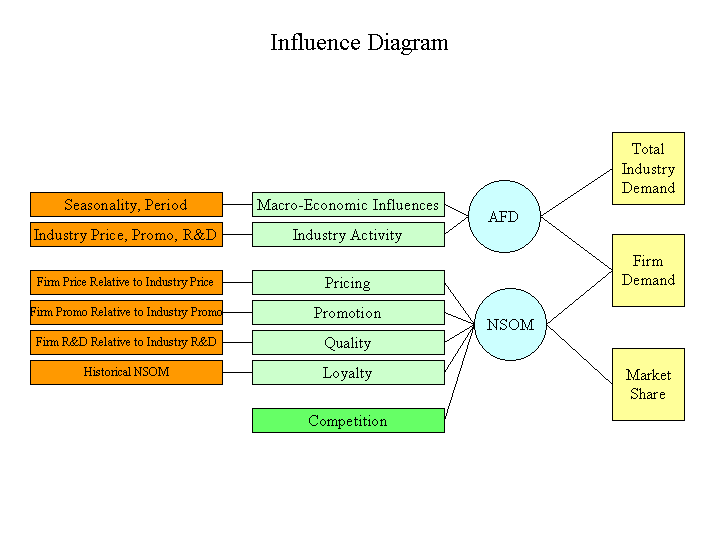
As you can see in this diagram, the outcome variables include Total Industry Demand, Firm Demand, and Market Share. These outcome variables are determined by the intermediate variables Average Firm Demand, and Normalized Share of Market.
The decision variables relevant to AFD include Macro-Economic Influences and Industry Activity, while the decision variables relevent to NSOM include Pricing, Promotion, Quality, and Loyalty. Competition also affects NSOM, but to a large extent, cannot be controlled.
Seasonality and Period, both uncontrollable variables, in-part determine Macro-Economic Influences, while Industry Price, Promotion, and R&D, all mostly uncontrollable, in-part determine Industry Activity. While Seasonality and Period are apparent, Industry Price, Promotion, and R&D are determined by taking the average for each during the prior quarter.
For Pricing, Promotion, and Quality, the firm component is totally controllable, while the industry component is to a large extent, uncontrollable. Historical NSOM is obviously uncontrollable. The firm component of Pricing, Promotion, and Quality, along with Historical NSOM values are easily determined by examining the firms' records. The industry component of Pricing, Promotion, and Quality can be transferred from the same source as in Industry Activity.